







Schedule a Call Back


Operational Optimisation: Turning Data into Smarter Decisions
 Articles
- Aug 28,26
As we put our efforts into optimising our operations, we now shift the discussion from operational flow to data-based operational decision-making. In this month’s column, Zurvan Marolia drives the message that operational optimisation begins when decisions move from opinion to evidence.

Those of us who have worked our way through decades of manufacturing operations have surely experienced the fact that we could walk through a factory, glance at a few machines, speak to a supervisor, and instinctively know whether operations were healthy. That skill and experience are still invaluable, but that alone cannot give us the surgical insight which is required to succeed in today’s competitive environment.
Today's businesses are far more complex, product portfolios have expanded and supply chains stretch across continents. Customer expectations are changing rapidly, production cycles are shorter, and margins are tighter.
In such an environment, intuition alone is no longer enough. Organisations that consistently outperform their competitors are not necessarily those with the most data. They are the ones that ask better questions and use data to answer them.
Organisations today have understood the need for data, and invest substantially in building “data-driven organisations”. They have walls lined with charts and spreadsheets but still find themselves short of answers which provide direction to actions required to drive performance.
Such organisations have fallen in the chasm between data and information - they are rich in data but poor in insights. They have fallen into the trap of measuring activity instead of performance!
Data | Information | Knowledge |
Raw, unorganised facts. | Processed, structured data. | Applied information. |
Independent pieces. | Structured in context. | Combined with experience. |
What? | Who, when, or where? | How or why? |
Raw input. | Meaningful message. | Actionable understanding. |
Data, information and knowledge together form a pyramid where each level builds on the one below it, and the pinnacle can only be reached with experience.
Lead vs lag parameters
Many organisations equate “Smart” with being data-driven, and believe becoming data-driven means collecting more data. In reality, the opposite is often true. The challenge is to identify the metrics that truly reflect operational health.
Let us take a quick scan of data which typically gets discussed in review meetings. Metrics generally viewed are:
Every department reports the data on which they are evaluated:
- Production – output figures
- Maintenance – breakdowns and response times
- Quality – rejection rates
- Stores – levels of inventory
- Sales – billing achieved and pending orders
Notice each of these parameters are a report of what has happened and what is achieved. These are all lag parameters which though important to identify and suitably acknowledge performance, do not provide us direction on how to move ahead.
They tell us what happened, not why it happened or what went wrong.
Such meetings become an exercise in reporting what had happened rather than understanding why it had happened. This leaves the organisation rich in data but poor in insight. It ends up measuring activity instead of performance.

The game changer here is to identify metrics which provide insight into likely outcomes – these are lead parameters which indicate areas of focus which will help the organisation foresee problems and take proactive action.
Lead parameters are based on trend lines plotted based on current data, which help us see where we are headed. Examples of such data include:
- Rise or drop in machine uptime
- Rise of drop in first-pass yield
The parameters selected vary from organisation to organisation and is dependent on the criticality of the industry or market in which it is operating.
Data-rich vs data-driven
Being data-driven does not necessarily require sophisticated software or AI. It requires clarity on what data will provide direction and help drive operational performance.
Take the above example, where we refer to the rise or drop in machine uptime. We can create trend lines for every machine leading to a visual overload, or we can focus on machines which are required to operate close to their capacity (bottleneck and potential bottleneck machines). This would give direction on where attention needs to be focused for “Optimised Improvements” (Refer: SM&E July 2026 edition).
The test of a “Data-Driven” dashboard is the speed with which direction of action emanates at a glance.
The purpose of data is not to describe operations, but to improve them.
Food for thought:
1. Which of your performance measures predict future problems, and which simply report past performance?
2. If we reduced your dashboard to ten critical metrics, which ones would remain?
The answers will reveal whether your organisation is data-rich or data-driven.
In conclusion
Technology has made data abundant. Wisdom lies in deciding which numbers deserve our attention. The objective is not to build bigger dashboards - it is to build better decisions.
Operational optimisation is not achieved by measuring everything; it is achieved by measuring what matters, understanding what the numbers are telling us, and acting before small deviations become major problems.
“Without data – all we have is an Opinion”
- Dr. Edward Deming
“Information is data endowed with relevance and purpose.”
- Peter Drucker
About the author:

Zurvan Marolia is the former Senior Vice President of Godrej & Boyce Mfg. Co. Ltd, part of Godrej Enterprises Group. He is a former member of the National Manufacturing Council of the Confederation of Indian Industry (CII), and a former Chair of the Manufacturing Council of Godrej & Boyce. Marolia is now a freelance consultant and can be reached at zurvan@takttime.com.
Zurvan Marolia
Data-Driven Manufacturing
Operational Optimisation
Smart Manufacturing
Manufacturing Analytics
Industrial Data Management
Performance Improvement
Future-Ready Factories
Data-Driven Decision Making
Manufacturing Intelligence
Factory Performance Analytics
Operational Excellence
Godrej & Boyce
Related Stories
Smart Manufacturing

LAPP scales Bhopal plant into its largest global facility
LAPP has expanded its Bhopal manufacturing facility in Madhya Pradesh, creating its largest global production site with advanced Power LV cable manufacturing capabilities.
Read moreSmart Manufacturing
Operational Optimisation: Turning Data into Smarter Decisions
As we put our efforts into optimising our operations, we now shift the discussion from operational flow to data-based operational decision-making. In this month’s column, Zurvan Marolia drives the..
Read moreSmart Manufacturing
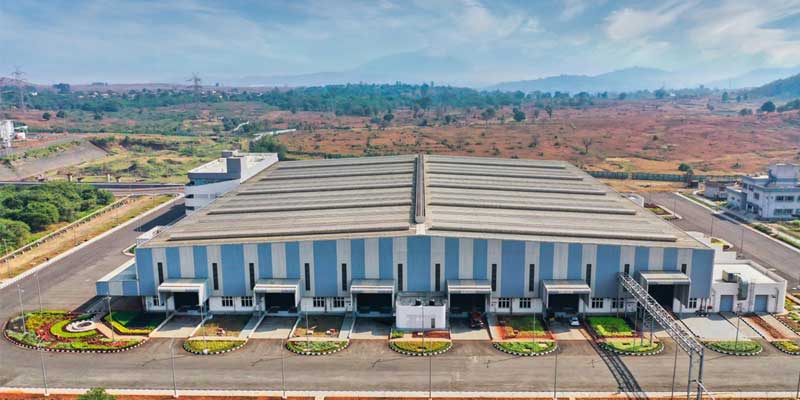
Godrej Khalapur Facility: Building Future-ready Material Handling Equipment
Godrej MHE, Khalapur facility, material handling equipment, Industry 4.0, smart manufacturing, automation, intralogistics, sustainable manufacturing, warehouse automation, indigenous manufacturing
Read moreRelated Products
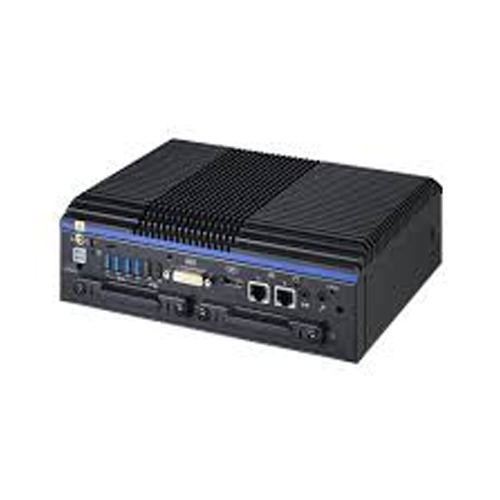
Fanless Industrial Pc for Smart Manufacturing
Smart Manufacturing
CONTEC Launches BX-M4600 Series - Fanless Industrial PC for Smart Manufacturing.
latest News
Subscribe to iNoW

For Industry News on WhatsApp, Give a Miss Call on: +91 84228 74016